Features
CrUX (Single CWV Test)
Auditzy CrUX (Chrome User Experience) feature provides insights into how real users experience a website in terms of loading speed and interactivity. The report can help website owners and developers identify areas for improvement and optimize user experiences by addressing performance bottlenecks and enhance loading times.
What is CrUX?
The Chrome User Experience Report (also known as the Chrome UX Report, or CrUX for short) is a dataset that reflects how real-world Chrome users experience popular destinations on the web.
With Auditzy CrUX you get the Performance & UX summary of the 75th percentile of the website visitors calculated over last 6 months from the date the report is getting generated.
How to get started with Auditzy CrUX?
There are two ways you can generate Crux Report inside the Auditzy ecosystem.
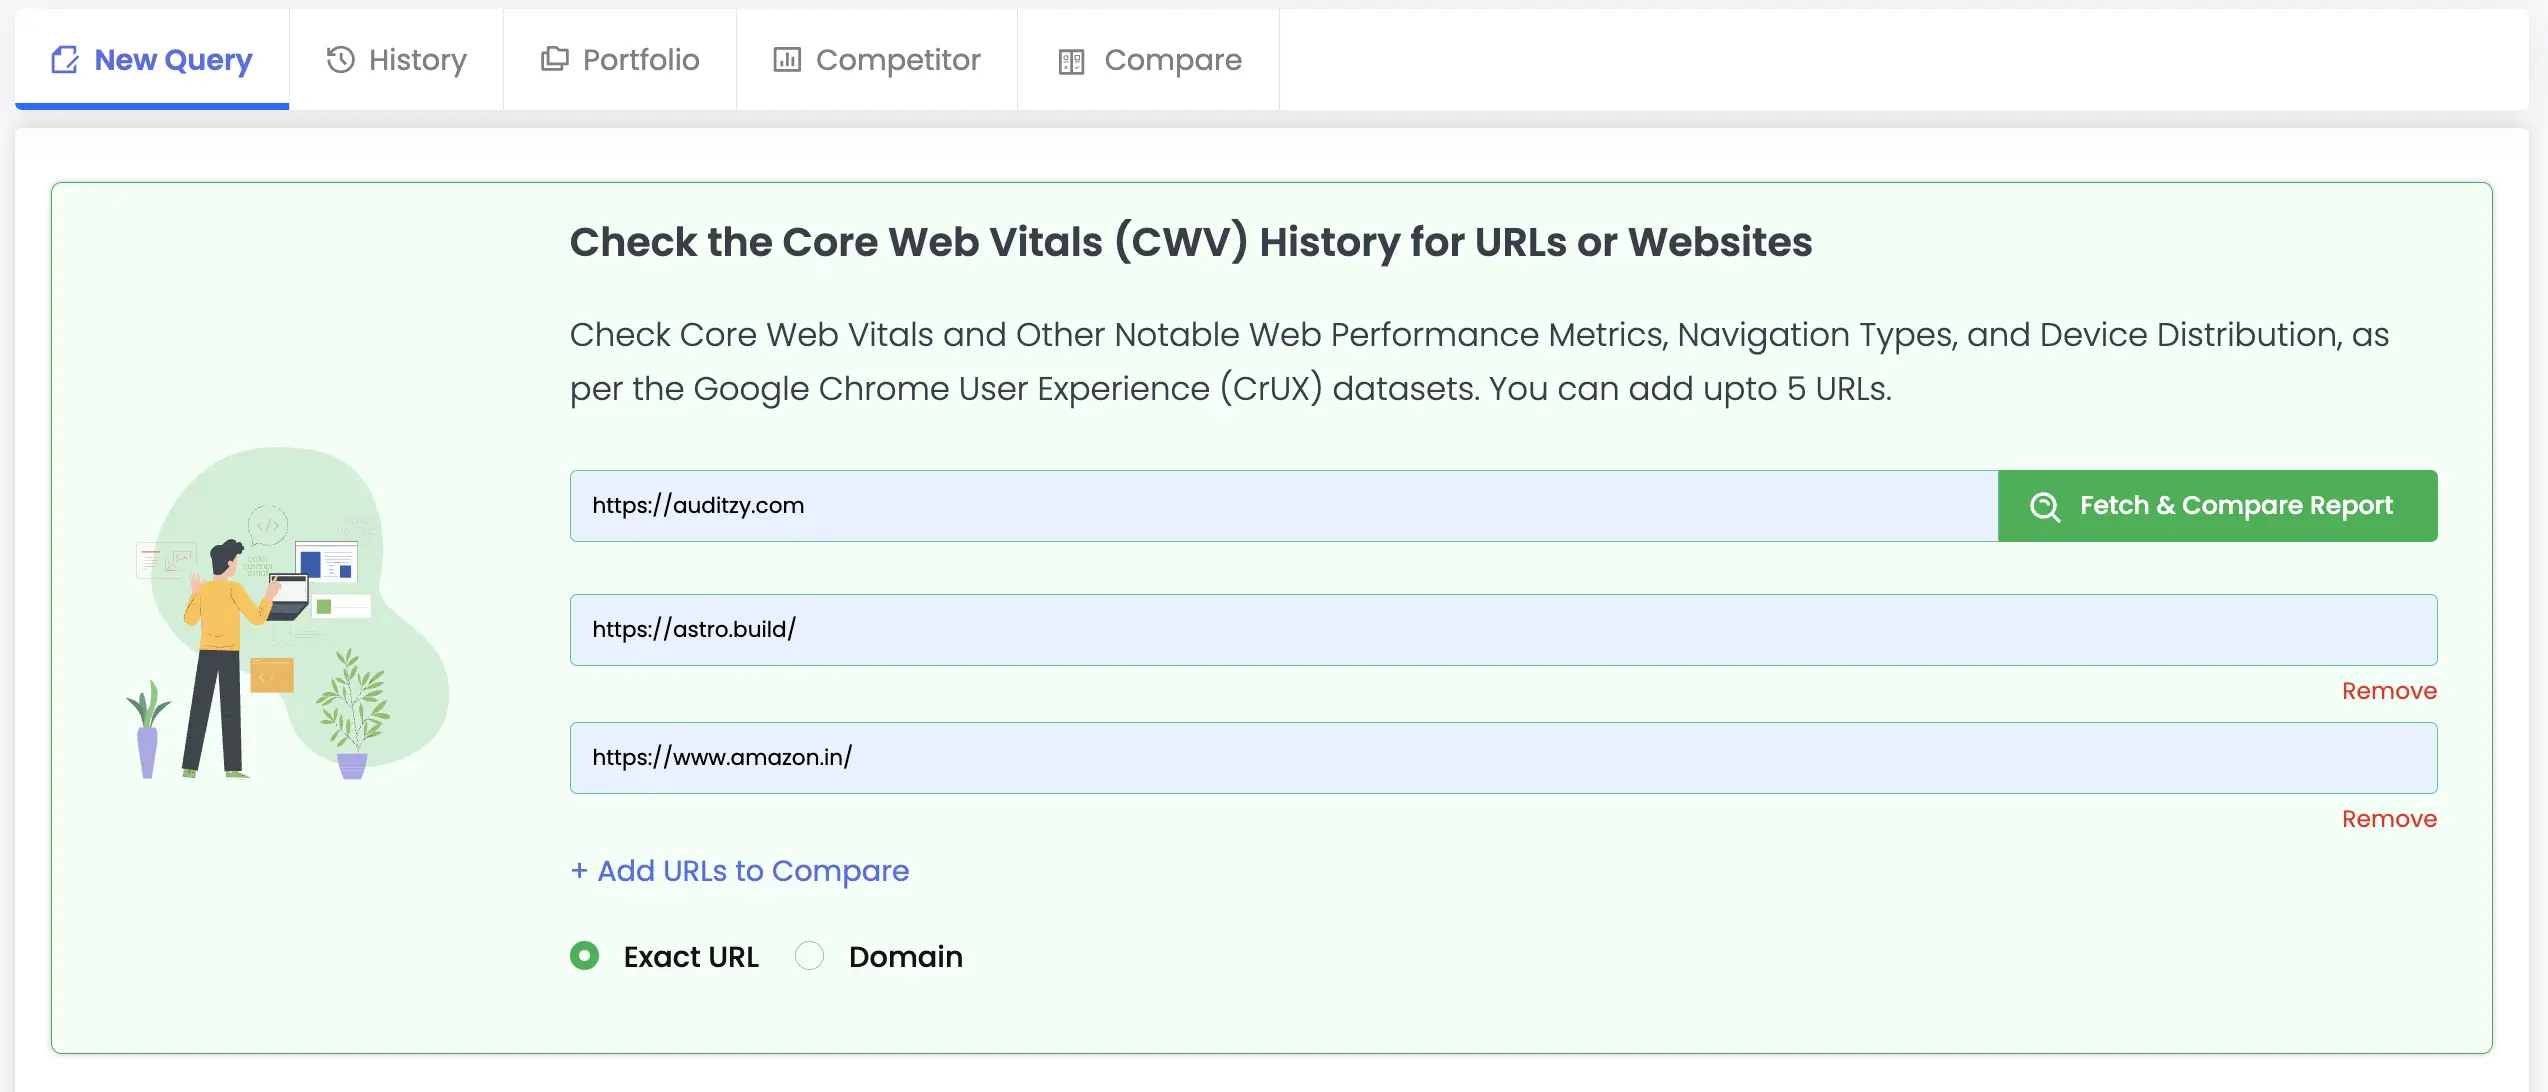
1. With Website Url
- Enter the precise Website URL or Domain URL in the designated field.
- With the +Add URLs to Compare button, you can add upto 5 URLs to compare. (If its a single URL, then single report will be generated)
- Choose the mode of CrUX report you want i.e. Exact URL or Domain.
- Click the Fetch Report button and patiently wait for the report to generate.
- If the Crux report is available for your website, the report will be displayed.
In case there is no data found for the selected URL, an error message indicating the URL will be shown.
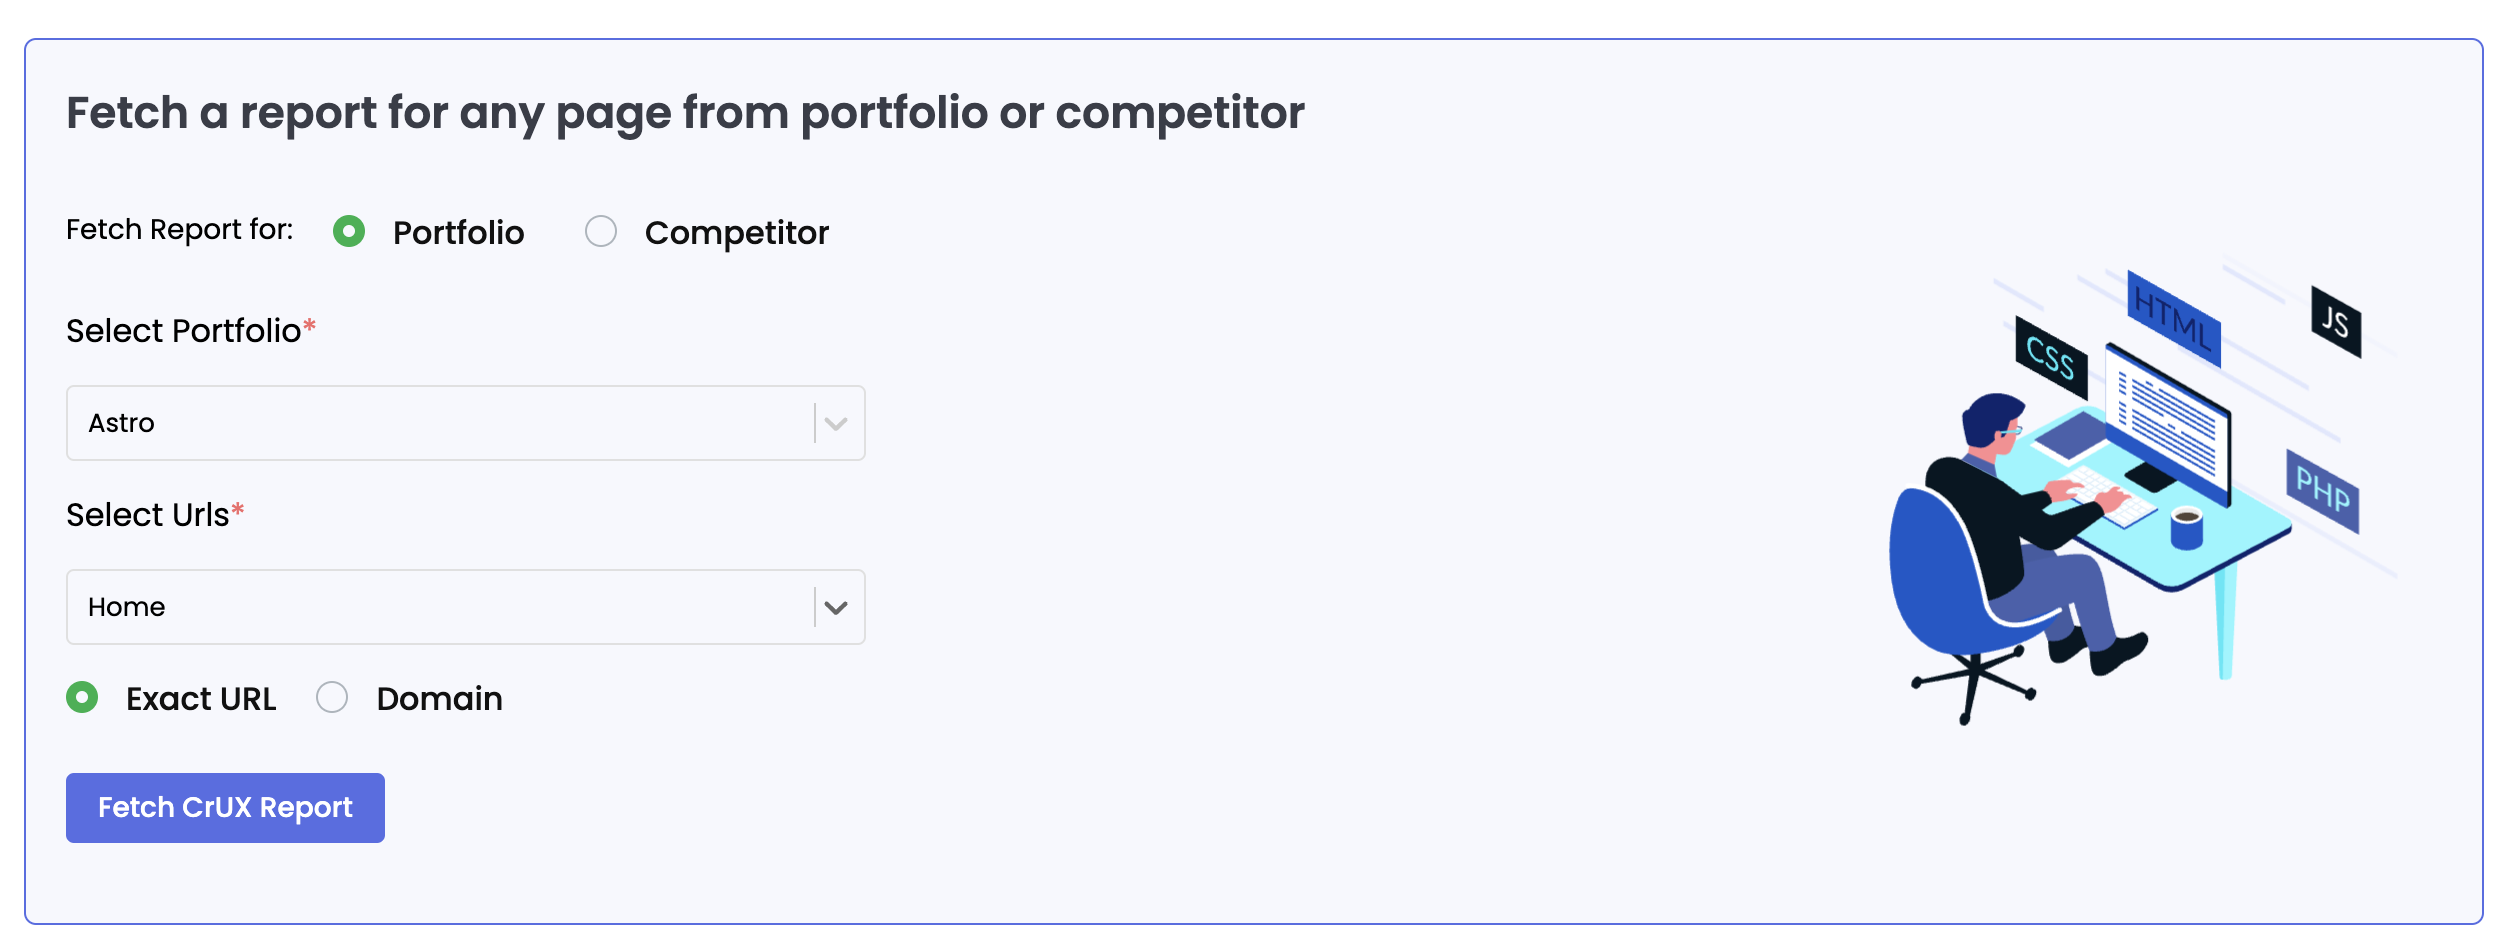
2. With Portfolio or Competitor Pages
- Select Portfolio or Competitor for which you want your report for
- Select the Website from the dropdown
- Select Page from the list
- Click the Fetch Report button and patiently wait for the report to generate.
- If the Crux report is available for your website, the report will be displayed.
In the event that No Crux report is found, an error message indicating Crux Report not Found will be shown.
This generally happens because CrUX data provides insights into user experiences on websites by collecting information from real browsers worldwide.
However, not all websites automatically have their data included in CrUX. To be eligible, a website must meet certain criteria such as being publicly accessible and having a significant number of visitors. This ensures accurate and relevant data for the CrUX report.
For more detailed information about CrUX and its criteria for website eligibility, you can refer to the official: CrUX Eligibility
Viewing the CrUX Report
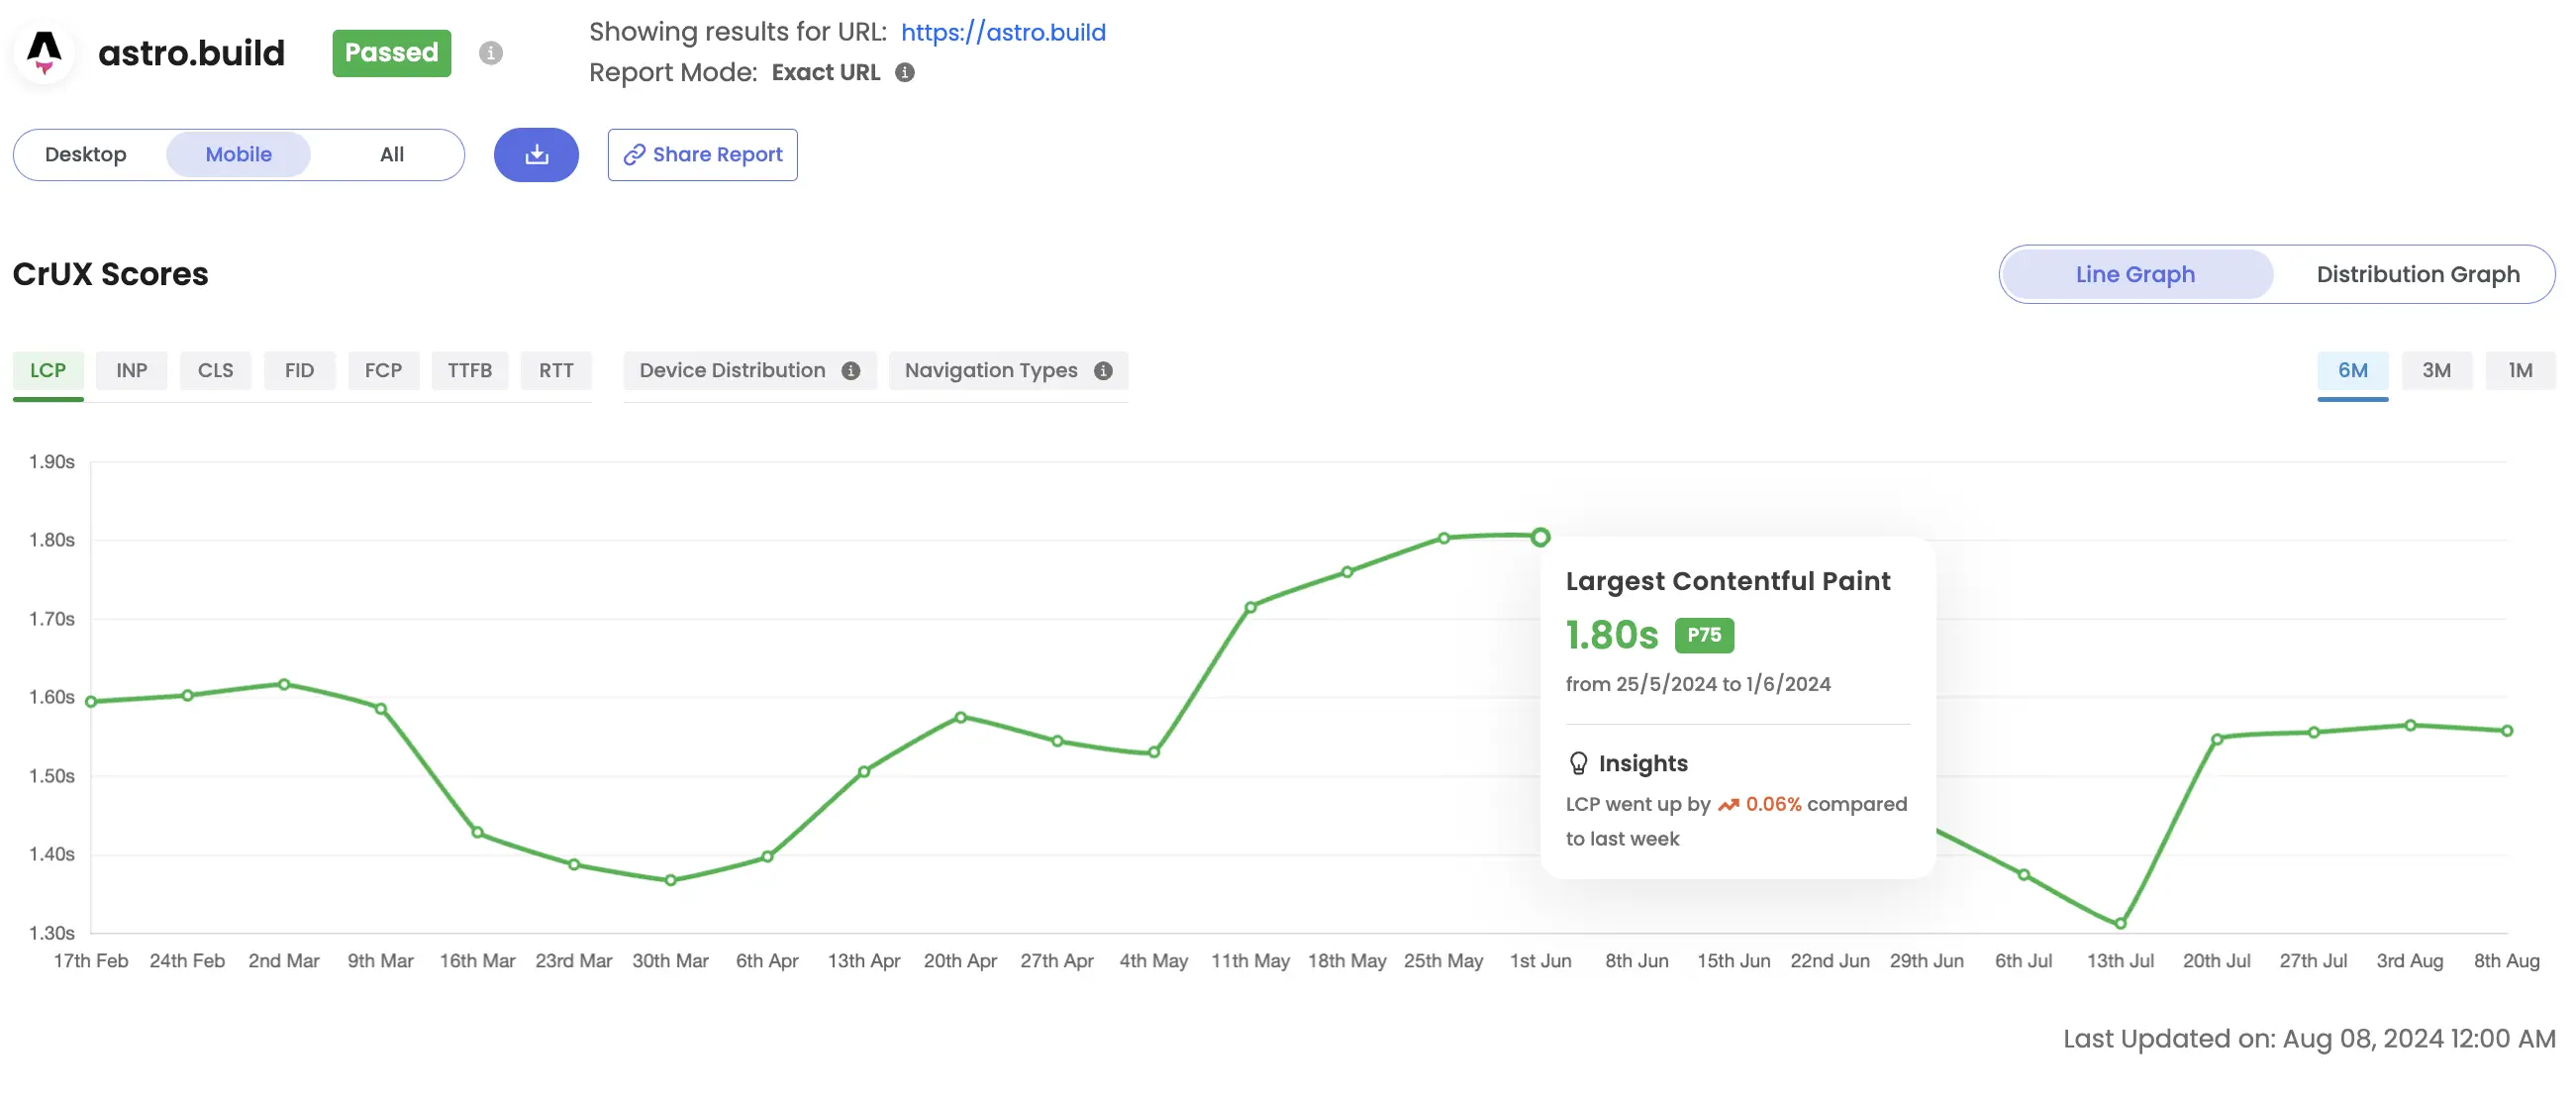
Once the CrUX report is generated, you will be redirected to the CrUX Report page. At the top of the report you will get the information if the URL is passing or failing the Core Web Vitals assessment. Below you have the Report type i.e. Exact URL or Domain basis and the toggle to switch between different device modes i.e. Desktop, Mobile & All.
A line graph depicting the data for the past 6 months will be displayed below. You can hover over the graph to view the data for a specific date.
Above the graph you will find all the Core Web Vitals and other Notable Metrics to view the data for. By default LCP will be selected at first.
On the right side, there is timeline switch to toggle between different time range of data. You have the option to view data for monthly, quarterly or half-yearly basis.
Additionally, users have the option to access data categorized by division, showcasing varying percentages of positive, improvement-worthy, or negative website experiences.

Round Trip Time (RTT) is a crucial metric that quantifies the time taken for a network request to travel from a user's browser to a server and back.
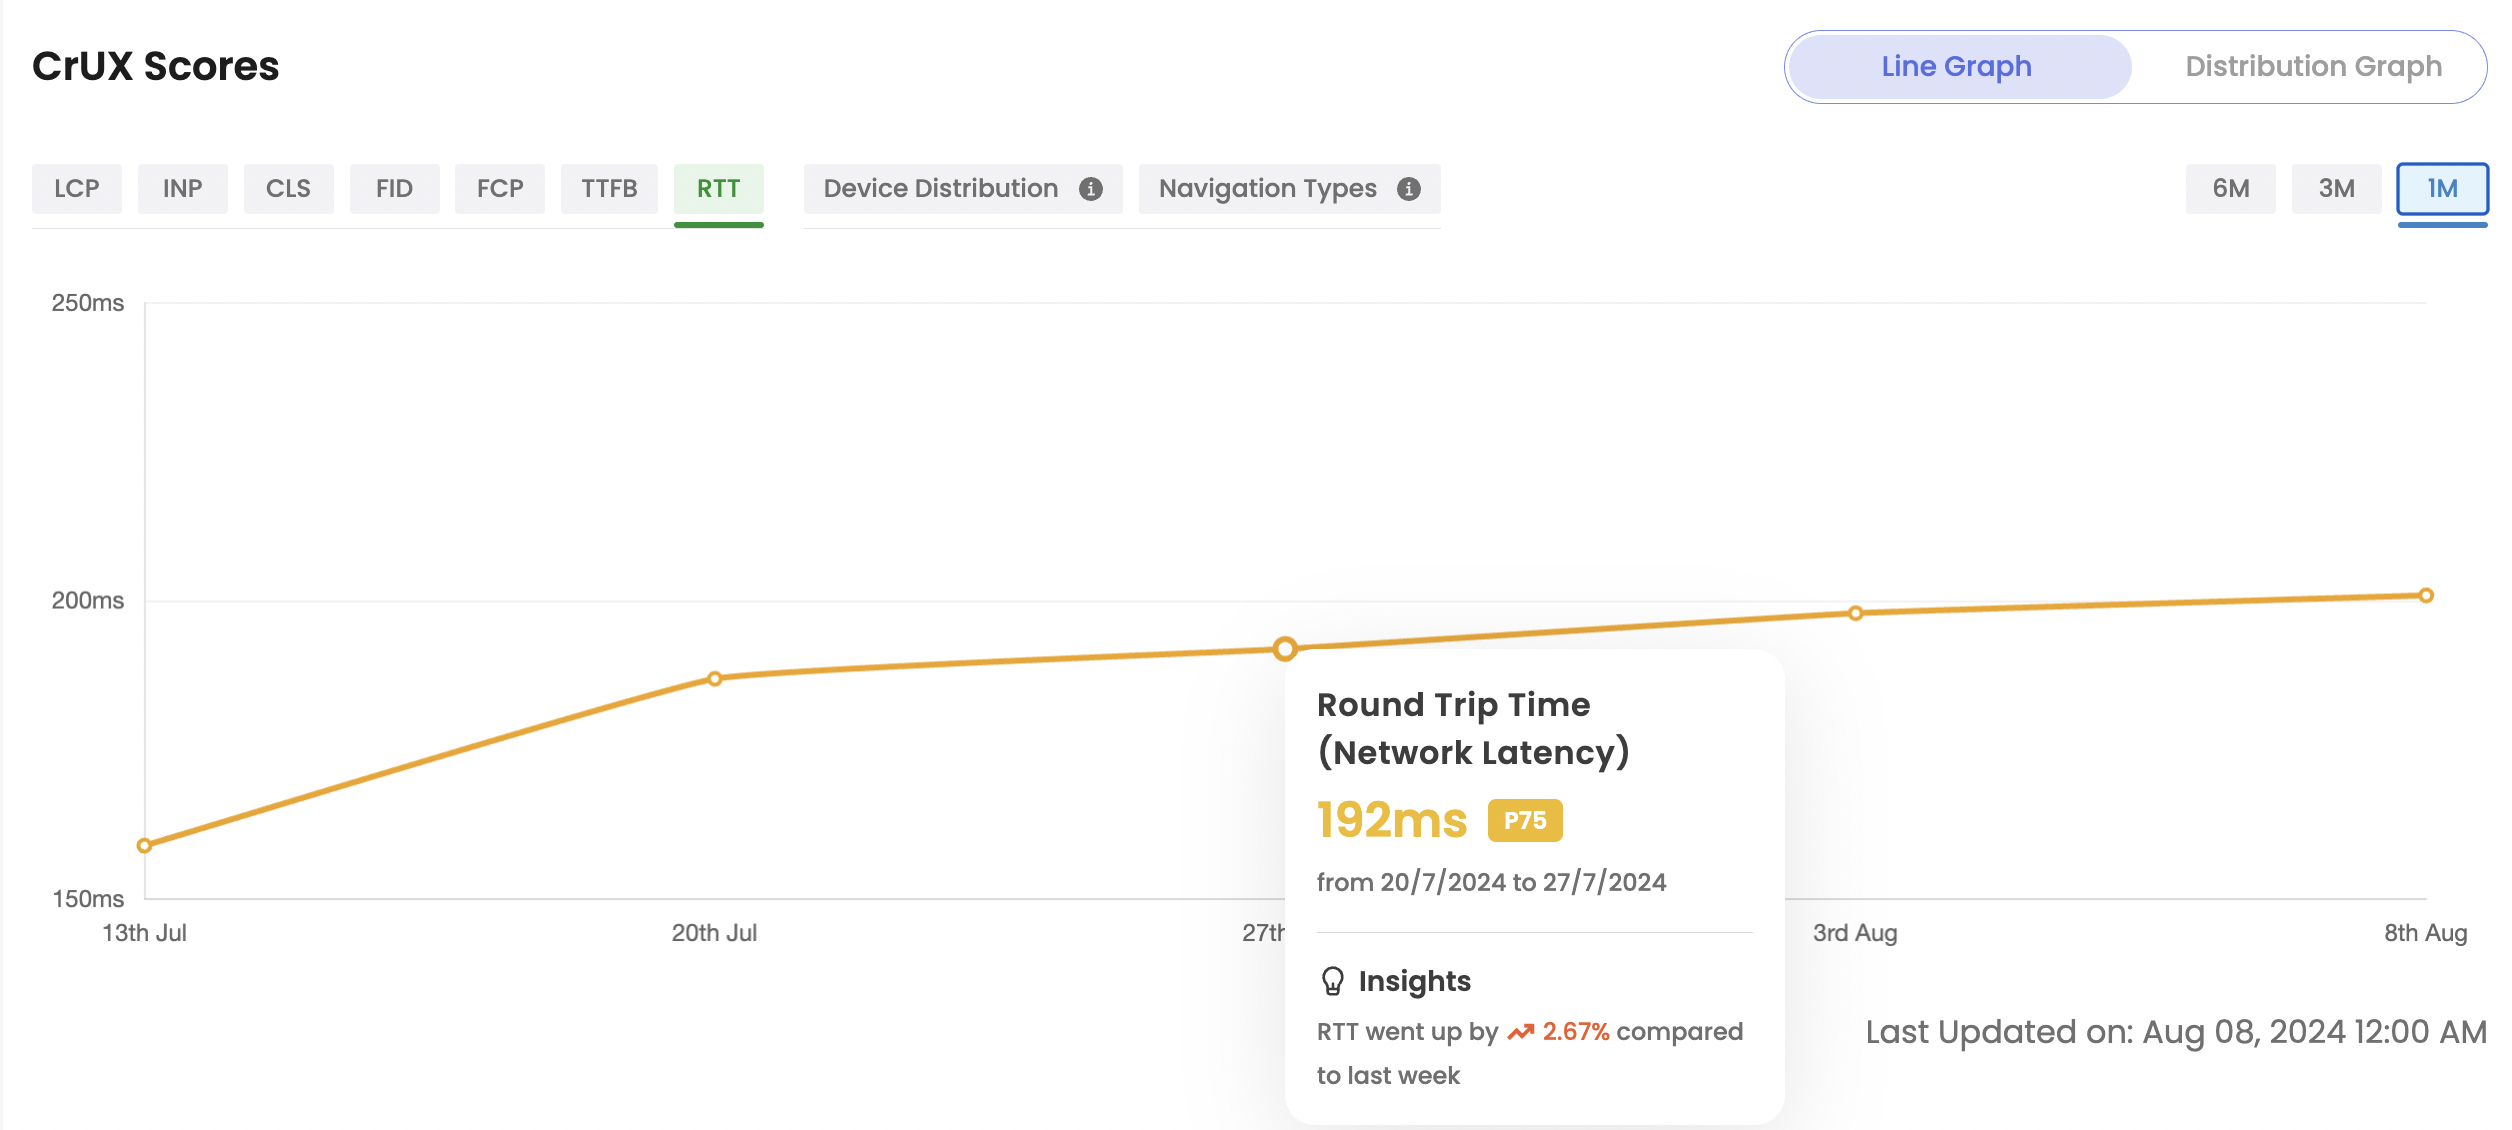
This measurement, expressed in milliseconds (ms), is essential for understanding the latency experienced by users when accessing a website. This metric is available across all device types—Desktop, Mobile, and All. The data will be available starting from July 2024.
Device Distribution provides insights into the percentage of users visiting from various devices, including Desktop, Mobile, and Tablet.

This metric is exclusively available for the All device type.
Navigation Types offers aggregated statistics on the various types of page load navigations.
Different navigation types can significantly impact performance metrics, making it important to understand their relative frequency when evaluating your site's performance. For instance, a navigation that utilizes the back-forward cache (bfcache) typically results in a near-instant load, leading to noticeably smaller LCP and FCP metrics, as well as reduced CLS and INP metrics.

Below the line graph you will find the current Core Web Vital scores for the URL with the user experience score depicting the percentage of users feeling the website experience is good, needs improvement or is poor.

You can view all your past generated reports from the History tab in the Single CWV Test page and click on the View Details button.
To view reports specific to a portfolio or competitor, select the Portfolio or Competitor Tab.
How to compare CruX Reports?
There are two ways to compare CrUX reports now:
1. With Website Url Directly from the New Query Tab
- Enter the precise Website URL or Domain URL in the designated field.
- With the +Add URLs to Compare button, you can add upto 5 URLs to compare. (If its a single URL, then single report will be generated)
- Choose the mode of CrUX report you want i.e. Exact URL or Domain.
- Click the Fetch Report button and patiently wait for the report to generate.
- If the Crux report is available for your website, the report will be displayed.
In case there is no data found for the selected URL, an error message indicating the URL will be shown.
2. With Website Url from the History Tab
- Select atleast two Crux reports from the History section.
- Click on the Compare button on the top right.
- Select either the Historical Compare or Metrics Compare to compare the reports.
- Wait for the report to generate.

Historical Compare takes into consideration the historical 6 months data for the selected URLs and prepares a bar graph depicting the differences in scores overtime for all the URLs.
Metrics Compare takes into consideration only the current data for the selected URLs and not the historical data.

You can view all the past generated comparisons of the Crux reports from the Compare tab in the Single CWV Test page. You can review previous comparison reports or initiate a new comparison by simply clicking the New Compare button.

Got Questions or Need Help??
Do you have inquiries or require assistance specifically related to Auditzy's Crux feature? Interested in a product demo to explore Crux functionality? Unsure about interpreting your Crux results? Our support team is here to provide the guidance you need!
Explore Auditzy Today
Start monitoring your website performance with Auditzy, or run a Free Historical Core Web Vitals Test today.