Real User Monitoring
Element Analysis
Element Analysis is a key feature of Auditzy RUM (Real User Monitoring) that offers detailed insights into the performance of individual webpage elements. This feature categorizes elements based on their impact on overall site performance, classifying them as Good, Average, or Poor performers.
The primary purpose of Element Analysis is to provide a granular view of how specific elements affect website performance, particularly in relation to Core Web Vitals metrics such as:
- Largest Contentful Paint (LCP)
- Cumulative Layout Shift (CLS)
- Interaction to Next Paint (INP)
Benefits of Element Analysis
By utilizing Element Analysis, developers and site owners can:
- Pinpoint specific elements causing performance issues

- Understand how elements perform for different users

- Prioritize optimization efforts based on element impact

- Improve Core Web Vitals scores through targeted enhancements

How to Use and Utilize Element Analysis to its Full Potential
This section provides a step-by-step guide on how to effectively use and maximize the potential of the Element Analysis feature in Auditzy RUM:
Navigate to the Element Analysis section in the Auditzy RUM dashboard.
At the top left corner below Element Analysis tab, select the desired Core Web Vital metric (LCP, CLS, INP) or Other notable metric like FCP or TTFB to analyze.
By default the Listing view is in the Url view mode i.e. the list of URLs with the elements that are impacting the performance of the selected metric. By default the URLs are sorted by the worst performing metric value and can be changed to sort in ascending or descending order.
An alternative Element view mode is also available. This mode lists elements impacting the selected metric's performance, sorted by the number of pages affected. This view helps prioritize optimization efforts by targeting elements with the widest impact first.

Use the Device filter to narrow results by device type i.e. Mobile or Desktop.
Performance filters (Passed, Failed, Need Improvements) allow data segmentation based on element performance i.e. For metric LCP, Passed filter will show the elements that are passing or have values less than equal to 2.5s and so on for Needs Improvement and Poor.
Opening each URL listing item will show you a detailed breakdown of the visitor persona, metric specific performance values and the element performance distribution across the respective page.
Lets deep dive into what each of the detailings mean:
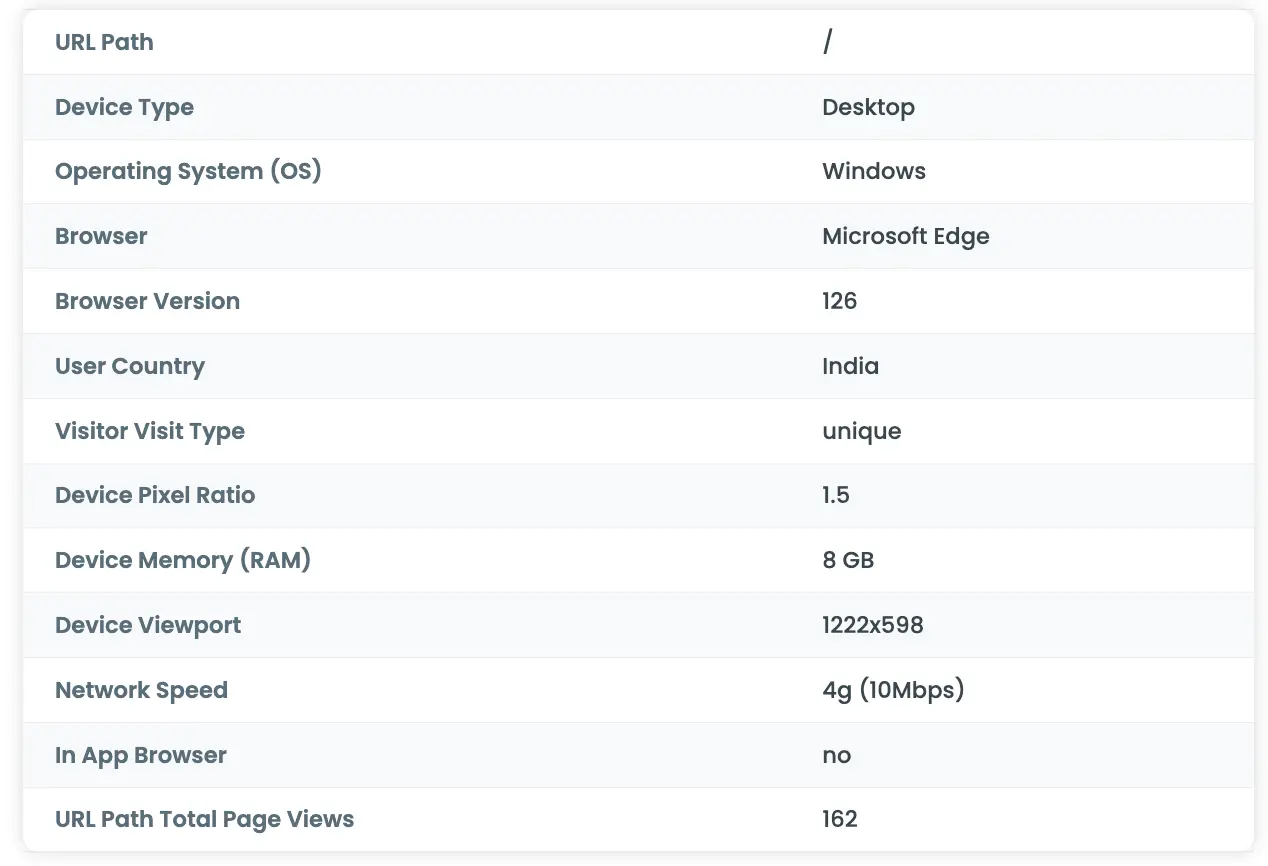
- Visitor Persona: This section provides a detailed breakdown of the visitor persona that is experiencing the performance issue.
It includes the following details:
- URL Path: The URL path of the page where the data was collected.
- Device: The device type (Mobile or Desktop) used by the visitor.
- Browser Details: The browser used by the visitor & version.
- OS: The operating system used by the visitor.
- Connection: The type of internet connection used by the visitor.
- Country: The country from where the visitor accessed the page.
- Viewport: The viewport size of the visitor's device.
Performance Insights & Element User Experience Distribution: This section provides detailed insights into the performance of the selected metric and the distribution of element performance across the page.
Metric Details provides the Current Element Metric Value vs the Overall p75 Metric Value, which helps in understanding how the element is performing compared to the overall page performance.
Total Page Views provides the total number of visitors who are accessing the URL for a given time period.
Metric Specific Element User Experience Distribution Graph helps in understanding the behaviour of the specific element (only valid for Core Web Vitals i.e. CLS, LCP and INP) across all website visitors for that URL. It breaks down the graph into 3 categories i.e. Good, Need Improvement and Poor based on the element's performance & with the defined Green, Yellow and Red colors.
For other notable metrics like FCP, TTFB, etc. the graph will show the distribution of the metric across all website visitors for that URL.

- Metric Specific Performance Values & Insights: This section breaks down each metric into detailed sub-metrics that are specific to each metric.
Below image shows how INP metric is broken down into different sub-metrics like INP LoAF Entries (Complete Object), Interaction Target, INP Current Src, and INP Processed Event Entries (Complete Object), etc which is helpful for the developers in debugging and understanding the behaviour of the specific element.

Hovering over the sub-metric tool-tip will give a brief description of the sub-metric.
- Utilize the Element View filter to prioritize optimization efforts:
The Element View filter allows you to narrow down results by element type, highlighting those with the most significant impact on your website's performance. By default, elements are sorted based on the number of URLs they affect.
When switching to the Exact URL filter view, the Element View displays the UX distribution for each element. Elements are then sorted with the poorest performing ones at the top, helping you identify critical areas for improvement.
Got Questions or Need Help?
For any inquiries or support related to Auditzy's Real User Monitoring (RUM) setup, configuration or understanding data, please don't hesitate to contact our support team.
Would you like to see a demo of our product? We're here to help you achieve your goals effectively.
Explore Auditzy Today
Start monitoring your website performance with Auditzy, or run a Free Historical Core Web Vitals Test today.