Real User Monitoring
Introduction
Speed is the heartbeat of user satisfaction & Real User Monitoring is your pulse-check for websites that leaves a lasting impression 🚀
Real User Monitoring (RUM) enables the collection of data regarding actual user experiences on your website. Auditzy evaluates Core Web Vitals metrics and supplements them with extra data to enhance optimization efforts.
Domain & Page Level Insights
Auditzy™ RUM is a powerful tool that offers in-depth insights into website performance, catering to both domain and page levels.
At the Domain level, Auditzy™ RUM offers users a comprehensive summary of website performance, including historical trends across Desktop, Mobile, and Overall Domain metrics. This overview allows users to track performance variations over time and gain insights into the overall performance trends across different platforms.
This includes metrics such as the Core Web Vitals:
- Largest Contentful Paint (LCP)
- Interaction to Next Paint (INP)
- Cumulative Layout Shift (CLS)
and other key performance indicators like
- First Contentful Paint (FCP)
- Time to First Byte (TTFB)
Percentile dropdown filter allows users to view the historical trend of performance for the desired percentile range (for ex. 25th, 50th, 75th, 99th, etc.).
This high-level perspective enables users to identify trends, patterns, and potential areas for improvement across the entire domain.

On the other hand, Page Level insights delve into the page specific performance details, offering a granular examination of individual pages within the website.
You can access the performance insights for exact page URLs or filter them based on specific with page patterns filter (for ex. /blog/*, /product/*, etc.).
You can also manage (save/delete) the page patterns for future reference for quick access.

Page-level insights additionally furnish users with a listing of the Top 10 Most Visited Pages categorized by mobile and desktop devices. This listing includes key metrics such as Page Views, the percentage split of each page's views relative to the total page views, and the total page views for each respective device category.

Whether users require a broad overview or a detailed analysis, Auditzy™ RUM equips them with the tools they need to effectively monitor and enhance their website's performance, ensuring a seamless and optimized user experience for visitors.
Factor Level Insights
Auditzy™ RUM furnishes insights into a spectrum of factors pivotal to a website's overall performance.
These factors include:
Visitor Browser: The specific browser employed by visitors to access the website.
Visitor Network: Configuration: The device utilized by visitors to connect to the website.
Visitor Location: The geographical location from which visitors access the website.
Visitor Device Memory (RAM): The amount of memory available on the device used by visitors to access the website.
Visitor Operating System: The operating system utilized by visitors to interact with the website.
These factors collectively exert a significant influence on a website's performance. Through meticulous analysis of these factors, users can pinpoint potential bottlenecks and fine-tune their website to optimize the user experience.
Each Factor Level Insight offers the following details:
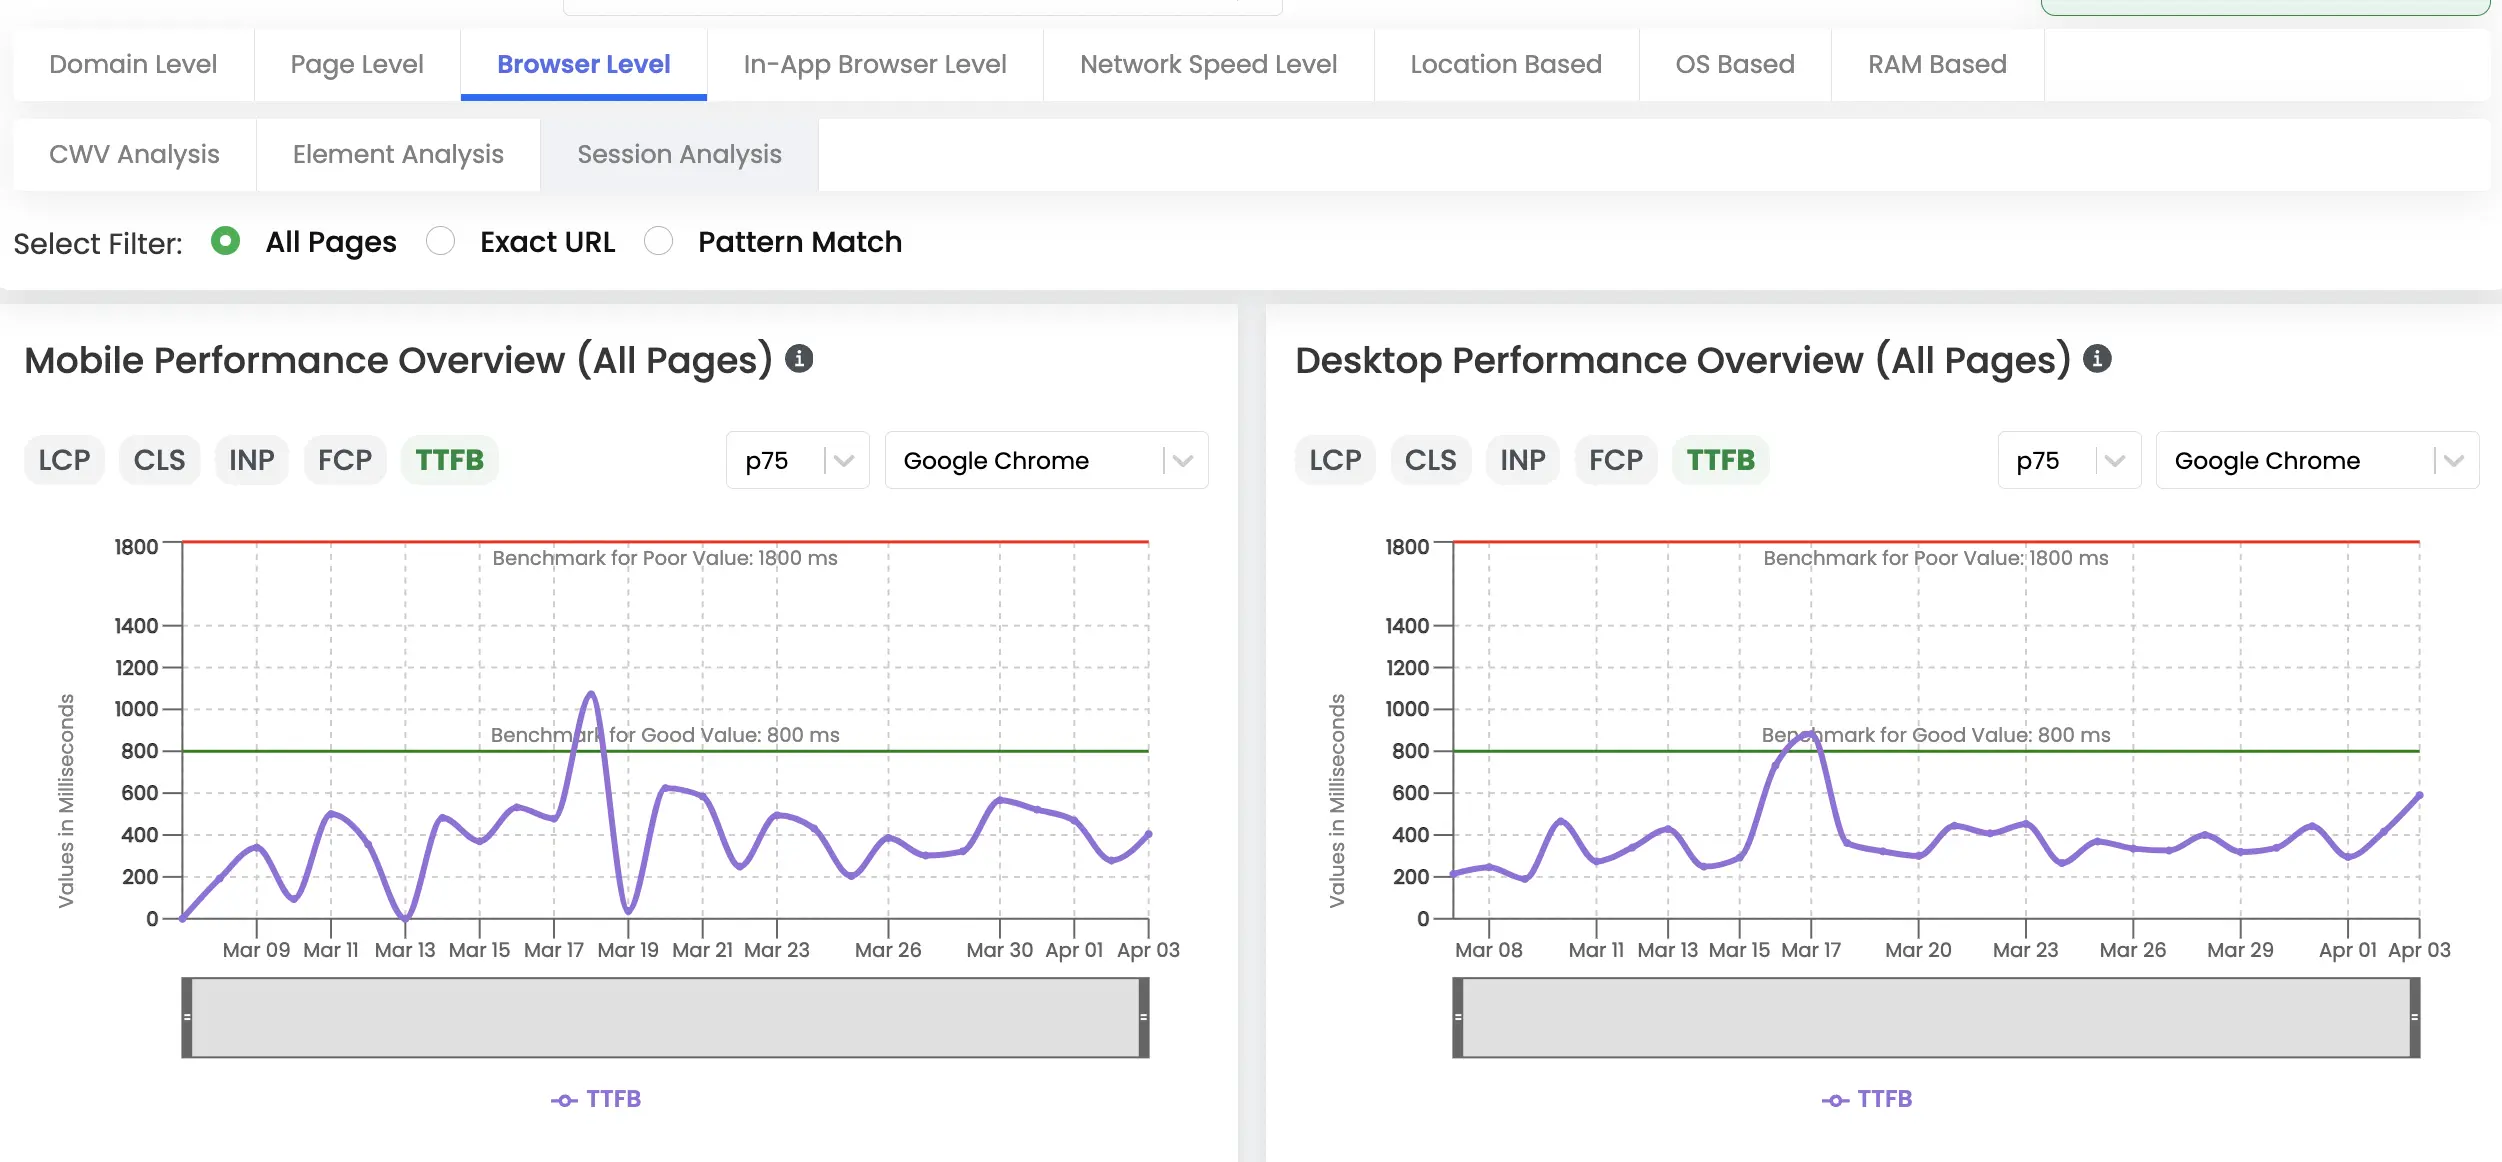
- Mobile & Desktop Performance Overview

The graphs presented in the preceding section illustrate a historical trend of performance metrics (such as LCP, CLS, INP, etc.) concerning the chosen factor (e.g., Browser - Google Chrome, Network - 4G (10Mbps), Location - India, etc.) and the specified percentile range (e.g., 25th, 50th, 75th, 99th, etc.).
- Top Mobile & Desktop Factors

The Top Mobile & Desktop Factors table provides a listing of Top 5 factors that have the most page views for the chosen factor (e.g., Browser - Google Chrome, etc.).
This listing includes key metrics such as Page Views, the percentage split of each factor's views relative to the total page views, and the total page views for each respective device category.
- Mobile/Desktop Session Overview by Top Factor (All Pages)

It represents the distribution of sessions and page views relative to the total website session and page views, focusing on the selected factor (e.g., Browser - Google Chrome, etc.).
- Returning vs Unique Visitors Count (Mobile/Desktop: All Pages)

This graph illustrates the distribution of returning and unique visitors, focusing on the selected factor (e.g., Browser - Google Chrome, etc.).
- Mobile/Desktop Single Page Views Count (All Pages)

This graph depicts the distribution of single page views, representing the number of users who drop off after viewing just one page depending on the selected factor (e.g., Browser - Google Chrome, etc.)
- Mobile/Desktop Avg. Page Views Count (All Pages)

This graph visualizes the distribution of average page views per session, indicating the average number of pages a visitor typically views during a session based on the selected factor (e.g., Browser - Google Chrome, etc.)
Core Web Vital (CWV) Analysis
The Core Web Vitals Analysis feature offers a condensed overview of URLs that meet or fall short of Core Web Vitals metrics, segmented by mobile and desktop devices. It also delivers metric-specific insights, such as Largest Contentful Paint (LCP), Cumulative Layout Shift (CLS), and Input Latency (INP), enabling users to pinpoint areas of improvement and prioritize optimization efforts for specific URLs.
Additionally, users have the option to toggle between various percentiles, allowing them to assess URL performance across different percentile ranges.

The Core Web Vitals Analysis Details Table presents a comprehensive list of URLs analyzed within a specified date range, indicating whether they pass or fail Core Web Vitals metrics. It includes crucial metrics like URL, Largest Contentful Paint (LCP), Cumulative Layout Shift (CLS), Input Latency (INP), and more for each device category evaluated.

Utilizing extensive filters allows for a deeper exploration of each metric, enabling users to identify URLs that meet specific criteria within that metric.
Element Analysis
Element Analysis provides a detailed examination of the impact of individual elements on a webpage, such as images, scripts, and css which are contributing to the layout shift, or is part of the largest content paint element.
This feature allows you to pin point the elements that are causing performance issues and optimize them for better performance.

Session Analysis
Session Analysis offers a comprehensive overview of user sessions on the website, providing insights into the distribution of returning and unique visitors, single page views, and average page views per session.
This feature enables users to gauge user engagement and retention, identify potential drop-off points, and optimize the website to enhance the user experience.
Got Questions or Need Help?
For any inquiries or support related to Auditzy's Real User Monitoring (RUM) about how it works, understanding Real User Monitoring data, or any other queries, please don't hesitate to contact our support team.
Would you like to see a demo of our product? We're here to help you achieve your goals effectively.
Explore Auditzy Today
Start monitoring your website performance with Auditzy, or run a Free Historical Core Web Vitals Test today.