Real User Monitoring
Understanding Percentiles
A percentile is a statistical measure that indicates the value below which a given percentage of observations in a group of observations fall.
This measurement allows you to understand the range of waiting times, from the fastest experiences to the slowest, giving you insight into how many users fall into each performance bracket.
What are percentiles?
In the context of web performance, percentiles help in analyzing how different segments of users experience your website's performance.
If the Largest Contentful Paint (LCP) metric's 75th percentile is 1.20 seconds, this indicates that 75% of users see the main page content load within 1.20 seconds, while the remaining 25% experience a longer load time.

To understand the 25% of users who face longer load times, you would examine the 90th or 95th percentile. Analyzing these slower experiences can provide insights for optimizing your website and enhancing performance for all users.
What do p25, p50, p75 and p99 mean?
- p25 (25th percentile): Represents the fastest 25% of user experiences
- p50 (50th percentile): Indicates the median user experience, with 50% of users having slower and 50% having faster load times
- p75 (75th percentile): Aligns with the Google CrUX dataset
- p99 (99th percentile): Reflects the slowest 1% of user experiences, potentially including outliers
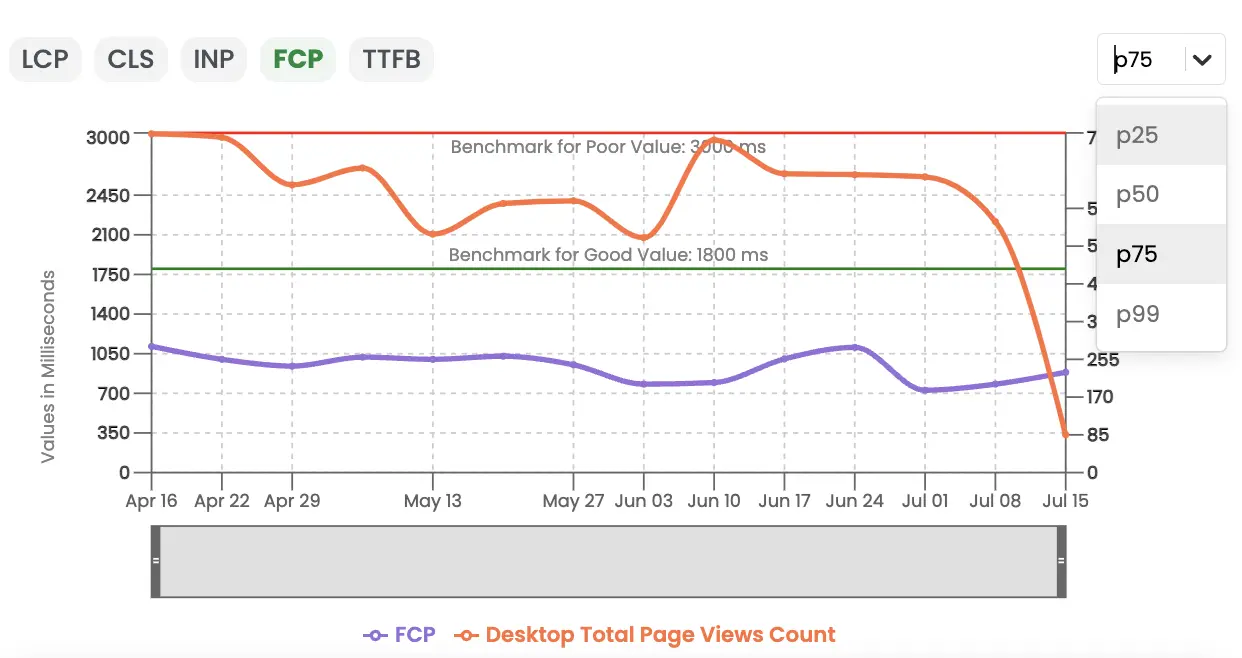
Auditzy RUM monitors real-time website speed for actual users and allows you to choose percentiles like p25, p50, p75, and p99 to analyze performance across different user segments.
To adjust your selection, click on the percentile dropdown menu and choose the desired percentile value.
Which percentile does Google use to report Core Web Vitals data?
Google reports Core Web Vitals metrics using the 75th percentile as a standard benchmark because it ensures that the majority of users have a good experience on your website & to prevent the metric from being skewed by outliers.
In the PageSpeed Insights report below, a p75 Largest Contentful Paint of 1.4 seconds indicates that 25% of users experienced a load time longer than 1.4 seconds for the main page content.

You can also use Auditzy's Free Historical Core Web Vitals Test to view the historical data for your p75 Core Web Vitals metrics.

Benefits of using percentiles
Granular insights: Percentiles provide detailed insights into user experiences across different performance brackets.
Optimization opportunities: Analyzing slower percentiles can help identify areas for improvement and optimization.
Benchmarking: Comparing your website's percentiles with industry benchmarks can help you understand how your performance stacks up against competitors.
Resistant to outliers: Percentiles are less susceptible to outliers than average or median values, providing a more accurate representation of user experiences.
If most users on your site wait 1 seconds for the page to load, but one user waited 50 seconds, the mean value would misleadingly suggest that your website is very slow.
However, percentiles ignore data above the chosen percentile value. If the p75 is 1 seconds, then whether other users wait 4 seconds or 12 seconds does not affect the metric value.
Limitations of using percentiles
On the other hand, while percentiles are resistant to outliers, they can overlook some user experiences in their calculation. Relying solely on the 75th percentile might give the impression that your website performs well for most users, but up to 25% of visitors could still have a suboptimal experience.
To mitigate this, it's advisable to examine multiple percentile values. For instance, assessing the p95 or p99 values alongside the p75 can provide a more comprehensive understanding of performance across different user groups.
How do Google's rating percentages correspond to percentiles?
Core Web Vitals tools such as PageSpeed Insights or the Auditzy's Historical Core Web Vitals Test not only display the 75th percentile value but also provide a breakdown of ratings into Good, Need Improvement, and Poor user experiences.
For instance, in one example, 83% of users experience a Good Interaction to Next Paint (INP) with a timing of about 161 milliseconds, while 14% of users range between the 200-500ms threshold, indicating a Need Improvement rating.
Additionally, 3% of users experience a Poor INP timing of over 500ms, highlighting areas for optimization.

Got Questions or Need Help?
For any inquiries or support related to Auditzy's Real User Monitoring (RUM) setup, configuration or understanding data, please don't hesitate to contact our support team.
Would you like to see a demo of our product? We're here to help you achieve your goals effectively.
Explore Auditzy Today
Start monitoring your website performance with Auditzy, or run a Free Historical Core Web Vitals Test today.