Features
Website Auditing
Auditzy Website Auditing or Synthetic Monitoring is a powerful feature that helps you monitor your website across 5000+ visitor personas.
Auditzy monitors your website's performance across 40+ devices, 12+ networks, and 13+ global locations, providing insights into varying performances and the impact of VFP (Visitor First Persona) on the website performance.
To get started follow the steps below:
Step 1: Create Portfolio
Once you are in the Auditzy dashboard click on the Add Portfolio button to add your portfolio details.

Portfolio is a collection of websites that you want to monitor. You can add multiple portfolios and each portfolio can have multiple pages.
Step 2: Input Portfolio Details
On clicking the Add Portfolio button, a modal will open up where you can input the portfolio details. It will ask you for the following details:
- Base Path URL Option - This new option enables you to create portfolios/competitors with similar domains and distinct base paths.
Previously, the system had limitations, preventing the creation of two portfolios with domains like example.com and example.com/us. In the previous setup, example.com/us would be treated as a page within the example.com portfolio, causing errors when attempting to add a new portfolio with example.com/us.
Now, with the Base Path as Domain URL option, you can seamlessly add both websites without any hiccups. The new option allows you to consider the base path as the domain URL, making the process smooth and hassle-free.
- Domain URL: URL of the portfolio (which typically should be the domain url or homepage url)
- Portfolio Name: Name of the portfolio (which will be autogenerated by our system, but you still can update it as per your choice)
(Below are optional steps, and you can skip them safely if you want)
Add Pages Manually: You can add subsequent pages manually for the portfolio using this option by copy/pasting the URLs of your website.

Add Site Map (XML): You can also add subsequent pages for the portfolio using this option by uploading the sitemap.xml file of your website. We will validate it and will automatically add all the URLs as pages for the portfolio.
Currently, we only process the child sitemaps and not the parent sitemap. So we recommend you to upload the child sitemap.xml file of your website.

- Industry Domain: You can also select the industry domain of your portfolio. This will help us to provide you with the industry-specific benchmarks and insights.
(This list doesn't contain all the industry domains, so if you don't find your industry domain in the list, you can either choose Others option or can email us at Support to add it)
You can then click on the Add button to add the portfolio. Once the portfolio is added, you will see it in the Portfolio Section in the Dashboard

Step 3: Auditing the Porfolio
Once the Portfolio is created, you can click on the Start Audit button to run an audit.
Audit is a process of running a Lighthouse test for a particular URL with a defined configuration of Network, Device & Location.
The Audit modal will have the following options:
Select Portfolio: You can select the portfolio for which you want to run the audit. (This will be auto-selected in most of the cases, but you can still change it)
Bulk Audit by: You can select the bulk audit option by either Pages, Devices, Networks, Locations. If you select Pages, then you can select multiple pages for which you want to run the audit, and similar for other options.
Select Pages: You can select the pages for which you want to run the audit.
Select Mode: Device mode i.e. Mobile or Desktop.
Select Device: Device configuration i.e. Macbook Air 2020 or iPhone 12 Pro. We currently offer 40+ devices to choose from.
Select Network: Network configuration i.e. 4G, 5G, Wifi, 3G Fast, etc. We currently offer 12+ networks to choose from.
Select Location: Location configuration i.e. California, Texas, Mumbai, etc. We currently offer 10+ locations to choose from.

(All the above options are mandatory to run an audit, and you can't run an audit without selecting any of the above options)
Scheduling is an optional step, and you can skip it if you don't want to schedule your audits
- Scheduling: If you want to schedule your porfolio to run at a defined interval without manual intervention, you can select the I would like to schedule my audits option and fill in the frequency (Daily, Weekly or Every X hours) and time details for it.
Once you have filled in all the details, you can click on the Next button to start the audit, which will start a processing queue at the bottom right of the page.

It takes an average of 30 seconds for the audit to complete depending on the URL. Once the audit is completed, the processing queue will be updated and you can click on the View Report button to view the report.

Step 4: Viewing the Report
Clicking on the View report button will redirect you to the Audit Detailed Report page, where the page will be divided into 3 different tabs i.e. Audit Report, HAR Insights & Core Web Vital.
Lets talk about each one of them in detail:
Audit Report
Audit report is a detailed analysis of the URL that you have audited on a pre configured lab environment (Network, Device & Location). The following details are provided at the top of the report, presenting information about the audited Portfolio, Page, and URL, along with the audit configuration, including the Browser, Location, and Lighthouse version used.
At the top of the report, you will find scores for various categories, namely Performance, Accessibility, SEO, Best Practices, and PWA. These scores serve as a tabular navigation, allowing easy access to the respective sections of the report.

Following which you have Performance report section that gives you summary about the Core Web Vital timings and respective colorings based on the thresholds if they are passing or failing.
Scorecard to understand the Green, Yellow, Red scores for the Core Web Vitals and a Screenshot for the page on the right side.

End of the report, contains detailed insights about Opportunities, Diagnostics, Passed Audits. These are very helpful in understanding the issues with the webpage and how you can fix them.

HAR Insights
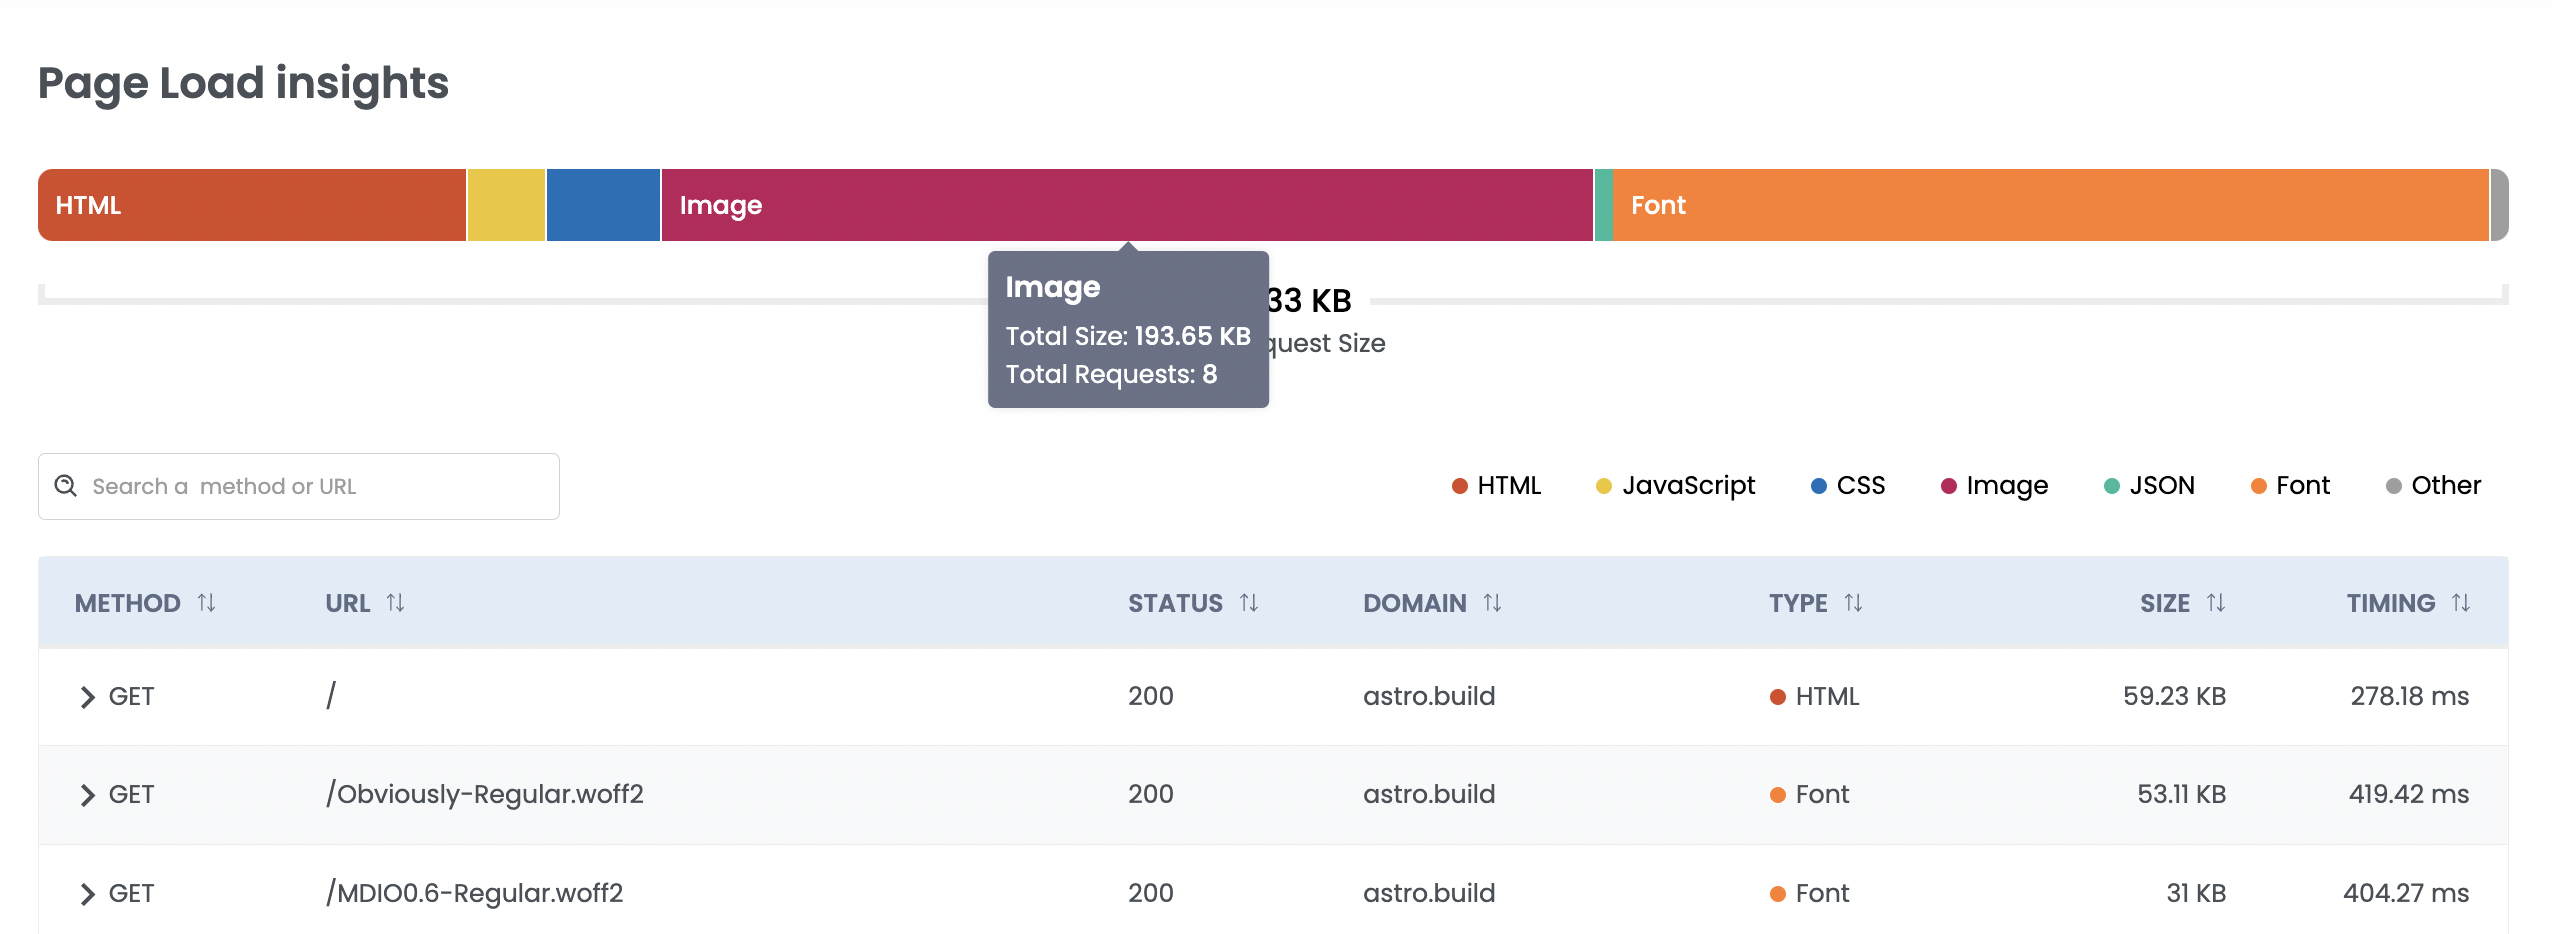
The HAR (Http Archive) Insights section provides valuable information about the page load, including details about the size of different asset types rendered on the webpage, such as JS, CSS, Images, Fonts, JSON, and more.
Below the insights, you will find a searchable and filterable table that provides comprehensive details about each request made by the webpage. The table includes columns for Method Type, URL, Status, Domain, Type, Size, and Timing, allowing you to sort the table based on any of these columns for further analysis and understanding.
Core Web Vitals
The Crux Scores section presents valuable information about the Chrome Real User Experience Dataset (CrUX) for the audited URL over the last six months.
It has filters to switch between different time periods (monthly, quarterly or half-yearly) and a toggle to switch between Total (Line graph) and Division (Bar graph) dataset. The report is generated for the device mode you choose to run audit on i.e. Desktop or Mobile.
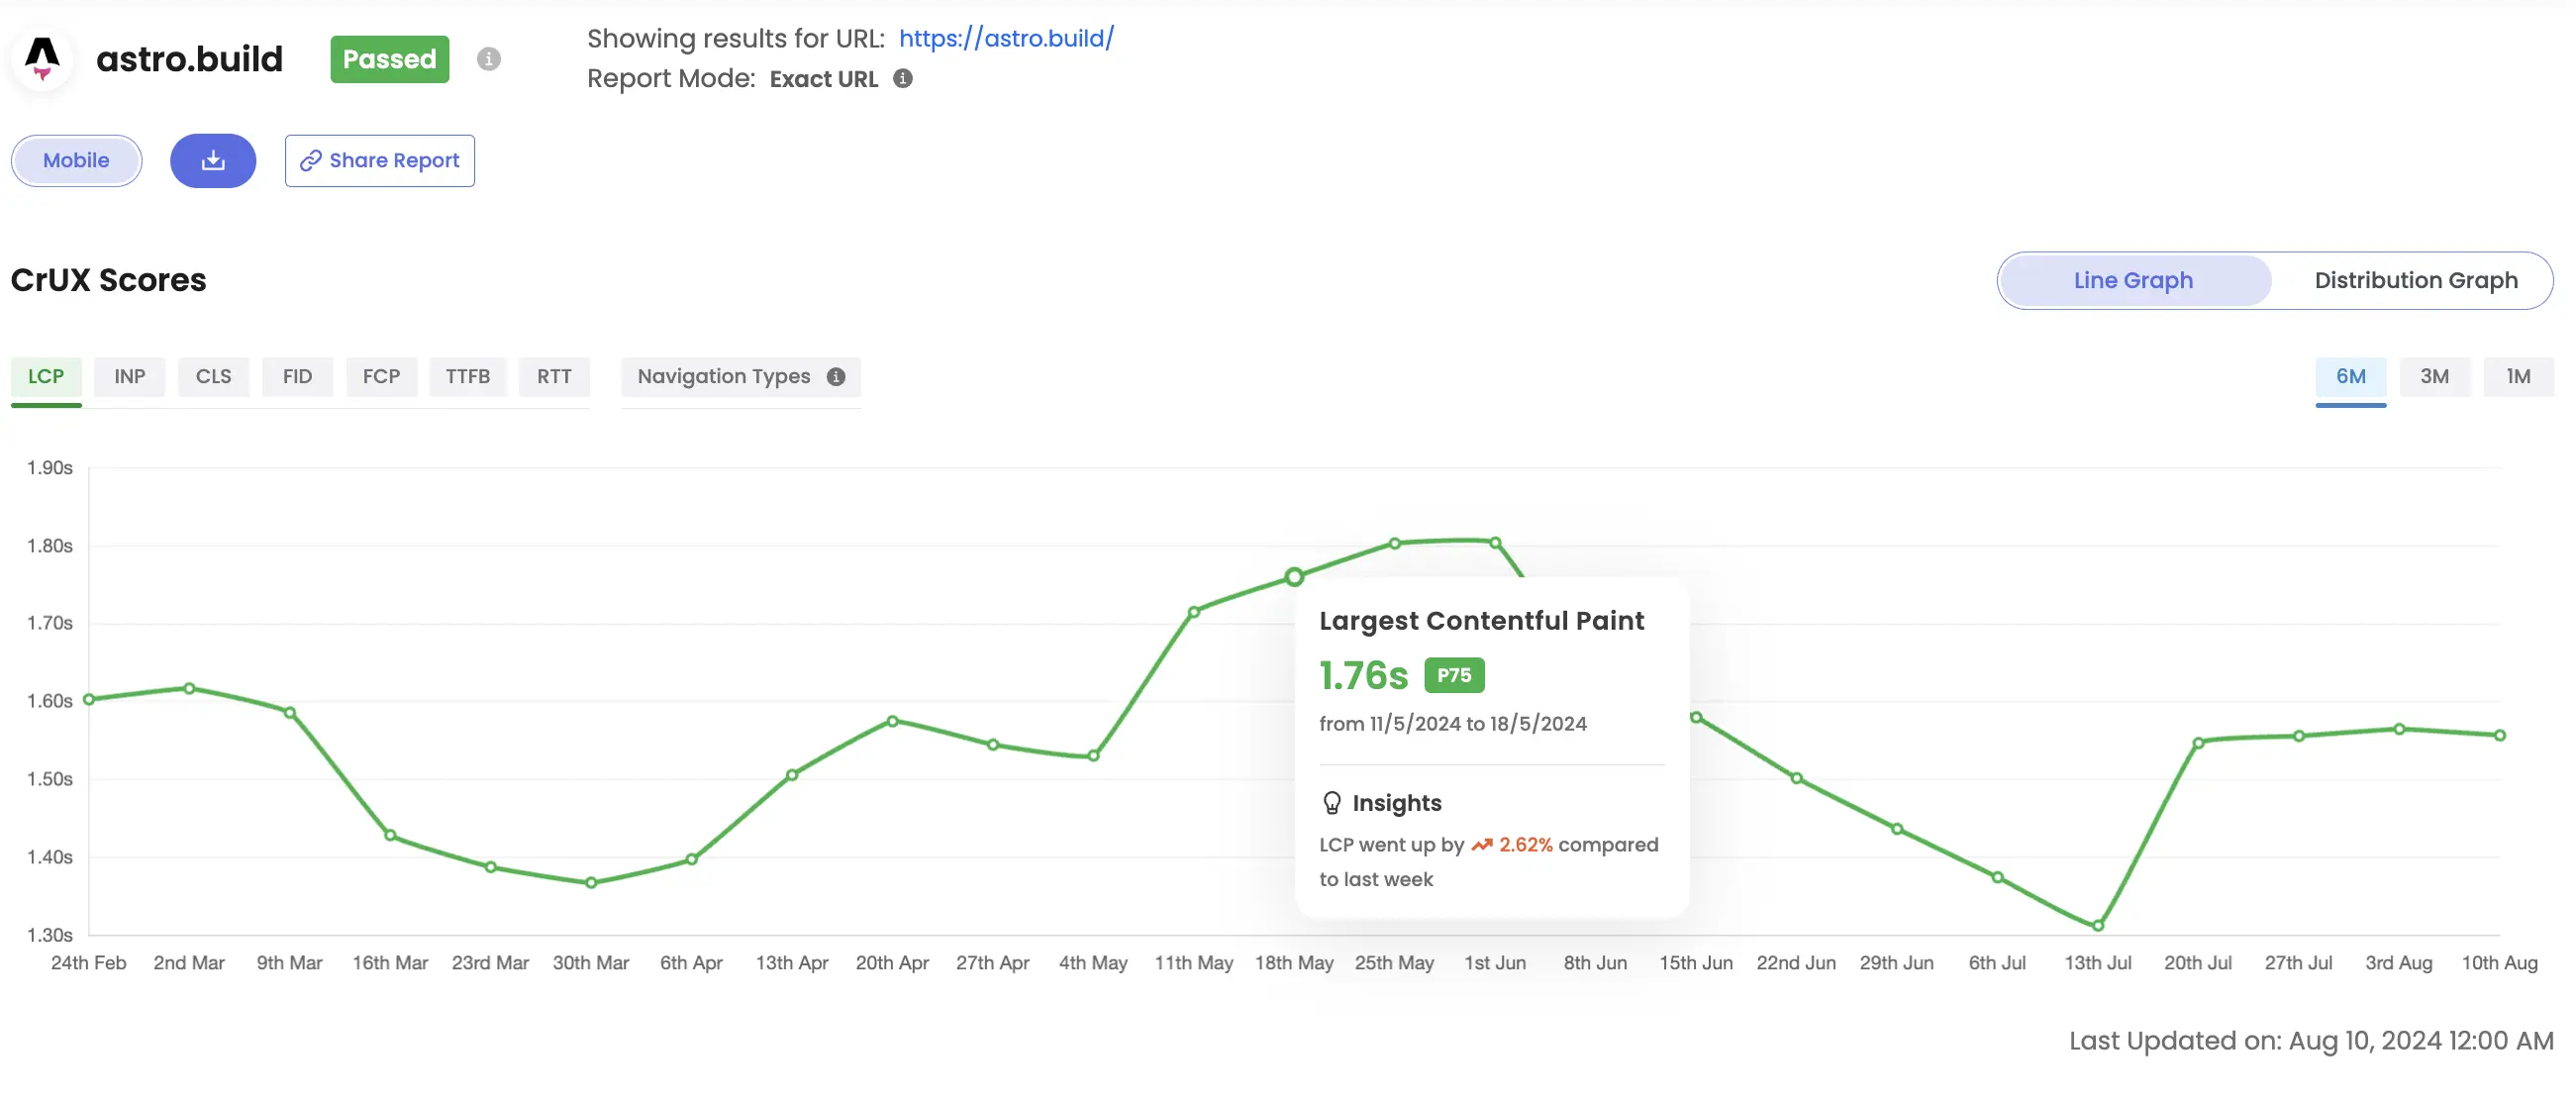
Following the Crux Scores is Core Web Vitals section, where you will find six cards that depict the timings and user experience percentages for each of the Core Web Vitals metrics (LCP, CLS & INP) and other metrics like FCP, TTFB & FID, etc.

Share And Download Report
Downloading or sharing a report for a specific page is a breeze! Simply click on the View Report icon located under the Action section of the desired page.
Once you're there, you'll spot the necessary buttons among others:
- Share Report :- Simply click this button to copy a link that you can share with anyone.
- Download Report :- Click on this button to download the report in PDF format.
- Slack :- You can also share your report through slack, To know more checkout Auditzy integration with Slack.

After completing these steps, you can continue your journey with Auditzy by exploring all its features. Alternatively, if you need assistance in establishing your speed strategy, feel free to reach out to our technical support team. They will be more than happy to help you.
Got Questions or Need Help??
Do you have any questions or need guidance specifically related to Auditzy's website auditing feature? Interested in a product demo? Need assistance interpreting your audit results? Our support team is here to assist you!
Explore Auditzy Today
Start monitoring your website performance with Auditzy, or run a Free Historical Core Web Vitals Test today.